In this article let's go through the Checkout REST dashboard together and have a better understanding of what insights you can get out of it.
To open the dashboard, follow the steps below.
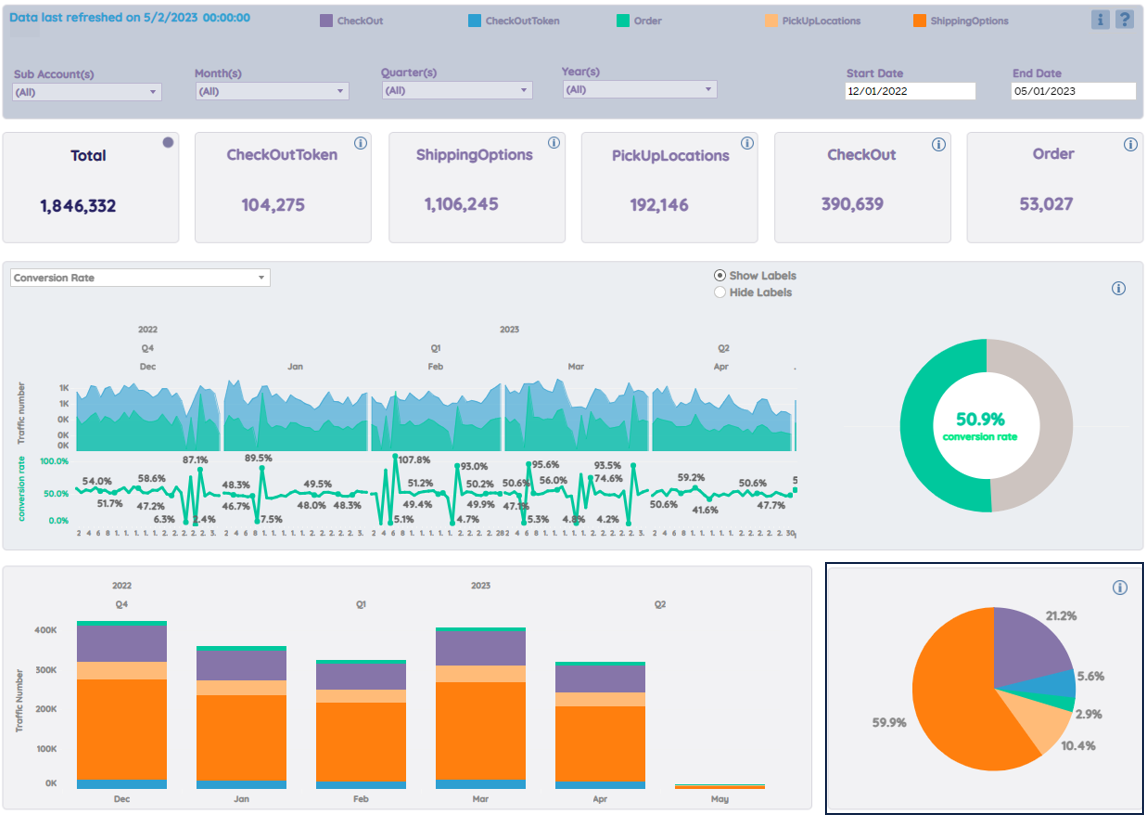
This dashboard focuses on 5 of the key REST API methods that are available for integration with your checkout: CheckOutToken, ShippingOptions, PickUpLocations, CheckOut, and Order.
- CheckOutToken: reflects the initiation of a Paazl delivery session in the checkout (Paazl returns an access token for the Paazl widget).
- ShippingOptions: gets the shipping options for home delivery, based on location details, shopping basket content, warehouse rules, etc. Also gets the available delivery dates, timeframes, etc.
- PickUpLocations: gets the shipping options to pick up locations, based on location details, shopping basket content, warehouse rules, etc. Also gets the available delivery dates, timeframes, etc.
- CheckOut: gets & saves preliminary checkout session data. For instance when a delivery option is changed during the session.
- Order: submits the final delivery order to Paazl.
This dashboard will give you insights into the volumes of requests to these endpoints over the last 5 months + current MTD, and how these numbers compare against each other.
Main Menu
Select the variables you want to include (or exclude) in the charts and cards.
Update Notification
Note
The dashboard is updated daily.
Manual & FAQ page
Go to the manual (information-icon) and FAQ page (question-icon) by clicking on the icons on the right top of the dashboard.
Key numbers
Hover over the i-icons on the right top of the cards to see the definitions of the endpoints and what they reflect.
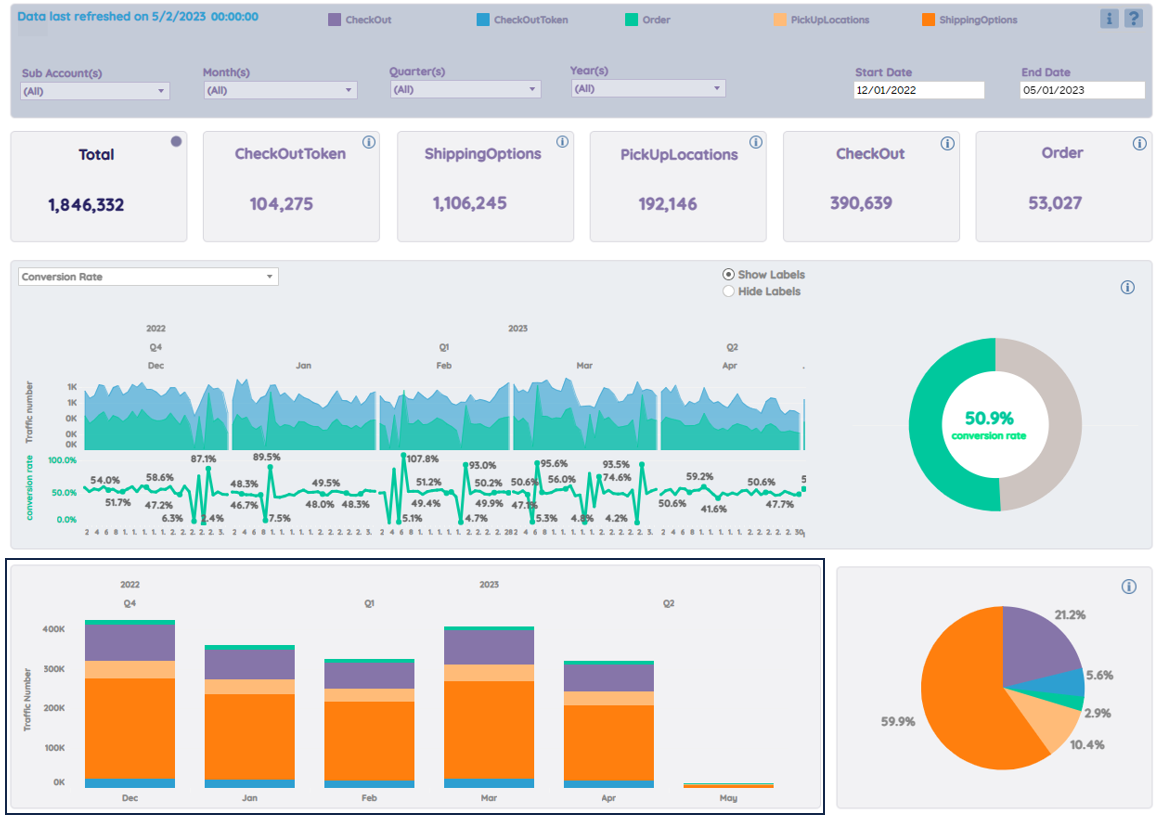
Charts – Conversion Rate
Offers the number of Order vs. CheckOutToken over time. The comparison represents a Conversion Rate, as it reflects the conversion of a delivery session into actual delivery order.
Click on the +(plus)/-(minus) buttons to drill down/drill up time levels.
Now it's on a monthly level.
Hover over the different areas to see:
- Day/Month/Quarter/year (based on the date level you choose)
- The number of Order or CheckOutToken
Hover over the line to see:
- Day/Month/Quarter/year (based on the date level you choose)
- Conversion rate (Order/CheckOutToken)
The donut chart on the right shows the conversion rate over the last 5 months + current MTD.
Charts – CheckOut Rate
Offers the number of CheckOut vs. CheckOutToken. The comparison represents a CheckOut Rate, as it reflects the average number of the preliminary delivery option changes per delivery session.
Click on the +(plus)/-(minus) buttons to drill down/drill up time levels.
Now it's on a quarterly level.
Hover over the different areas to see:
- Day/Month/Quarter/year (based on the date level you choose)
- The number of CheckOut or CheckOutToken
Hover over the line to see:
- Day/Month/Quarter/year (based on the date level you choose)
- CheckOut Rate (the average number of CheckOut per CheckOutToken)
The bar charts on the right show the total number of CheckOut and CheckOutToken as well as the CheckOut Rate.
Charts – ShippingOptions Rate
Offers traffic number of ShippingOptions vs. CheckOutToken. The comparison represents a ShippingOptions Rate, as it reflects the average number of home delivery options requests per delivery session.
An additional request is usually triggered by a change in the shopping basket or a change of delivery location details.
Click on the +(plus)/-(minus) buttons to drill down/drill up time levels.
Now it's on a monthly level.
Hover over the different areas to see:
- Day/Month/Quarter/year (based on the date level you choose)
- The number of ShippingOptions or CheckOutToken
Hover over the line to see:
- Day/Month/Quarter/year (based on the date level you choose)
- ShippingOptions Rate (the average number of ShippingOptions per CheckOutToken)
The bar charts on the right show the total number of ShippingOptions and CheckOutToken as well as the ShippingOptions Rate.
Charts – PickUpLocations Rate
Offers the number of PickUpLocations vs. CheckOutToken. The comparison represents a PickUpLocations Rate, as it reflects the average number of pickup locations requests per delivery session.
An additional request is usually triggered by a change in the shopping basket or a change of delivery location details.
Click on the +(plus)/-(minus) buttons to drill down/drill up time levels.
Now it's on a monthly level.
Hover over the different areas to see:
- Day/Month/Quarter/year (based on the date level you choose)
- The number of PickUpLocations or CheckOutToken
Hover over the line to see:
- Day/Month/Quarter/year (based on the date level you choose)
- PickUpLocations Rate (the average number of PickUpLocations per CheckOutToken)
The bar charts on the right show the total number of PickUpLocations and CheckOutToken as well as the PickUpLocations Rate.
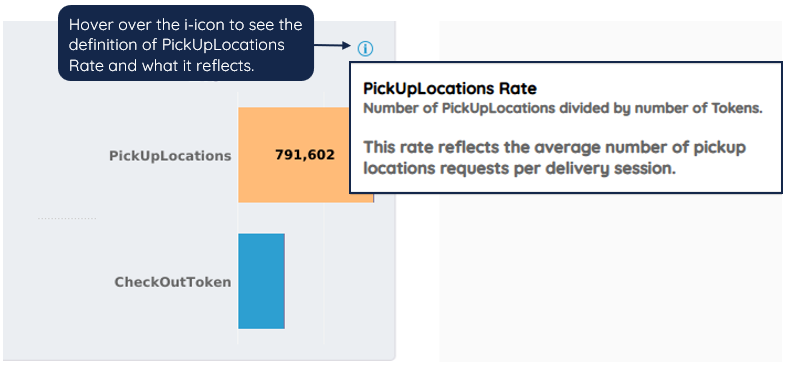
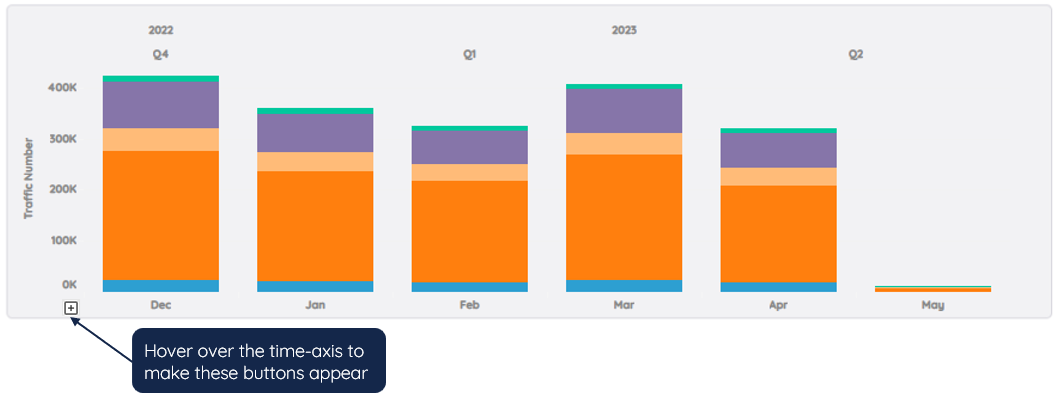
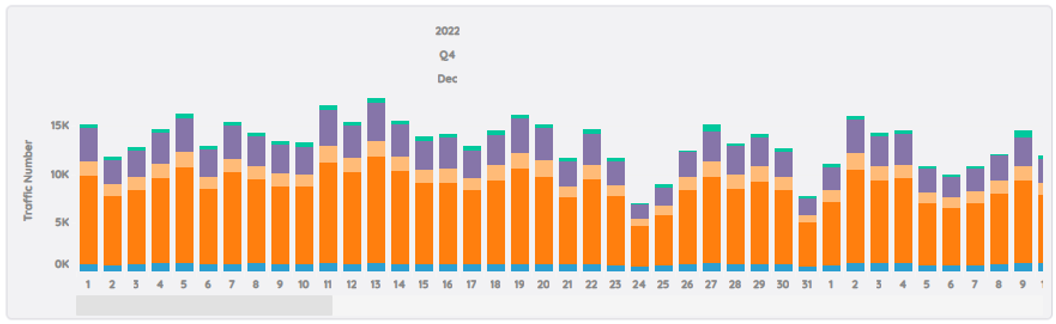
Chart – Traffic Per Endpoint Over Time
Breaks down the total number of requests per endpoint over years, quarters, months, and days.
Click on the +(plus)/-(minus) buttons to drill down/drill up time levels.
Now it's on a daily level.
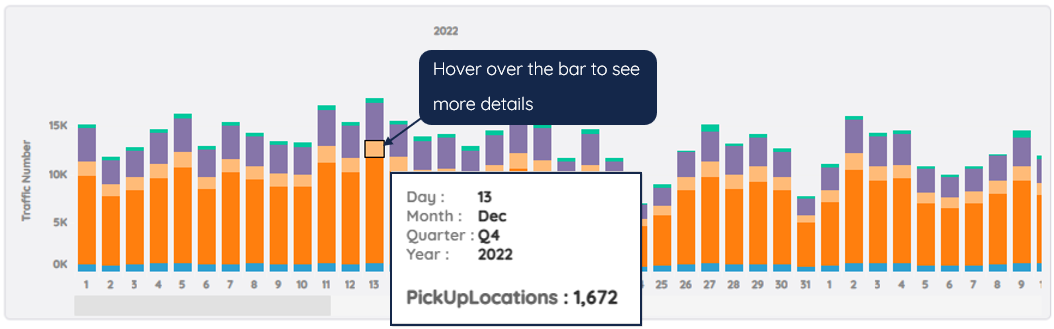
Hover over the bars to see:
- Day/Month/Quarter/year (based on the date level you choose)
- The type of endpoint
- The number of requests per endpoint
Chart – Traffic Per Endpoint
Breaks down the total number of requests per endpoint over the selected period.
Hover over the pie to see the percentage and volume of different endpoints.
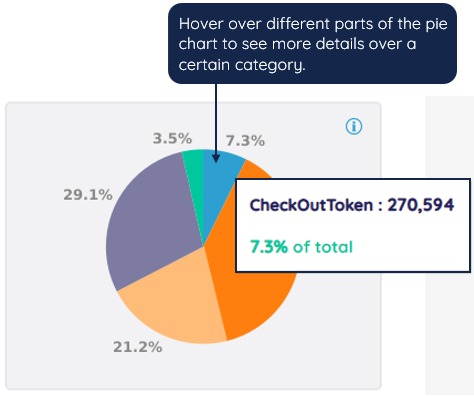
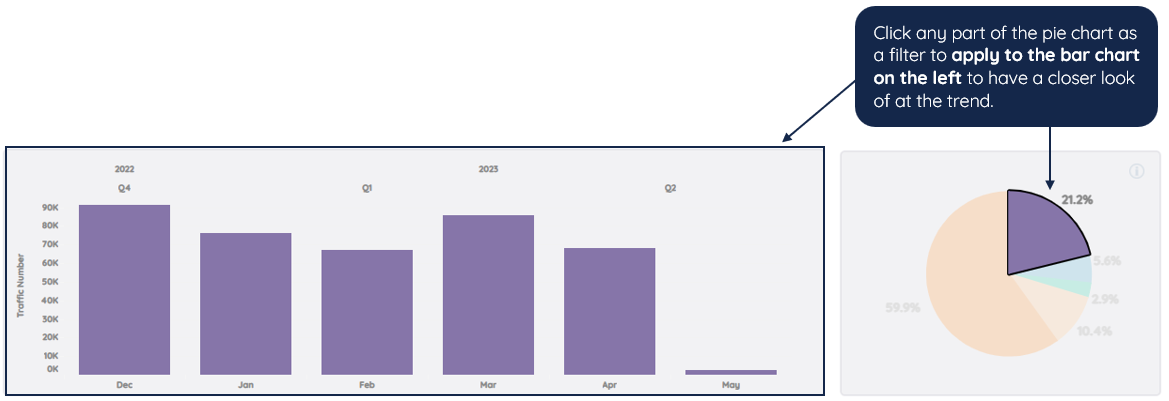
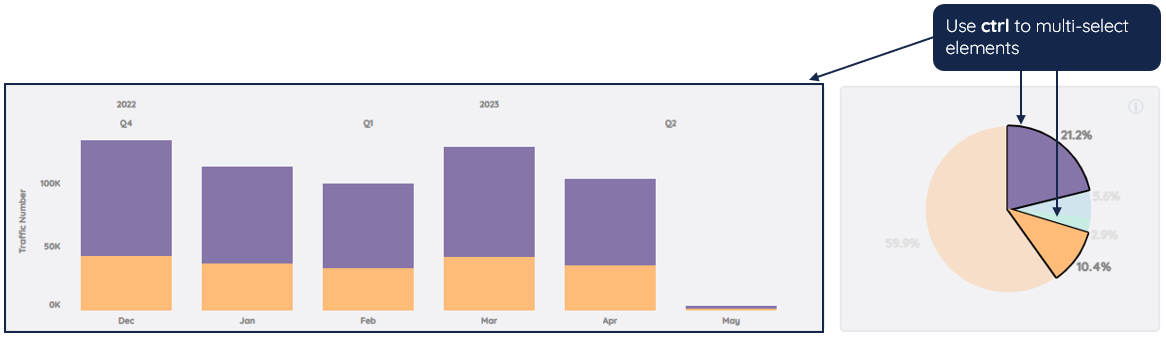
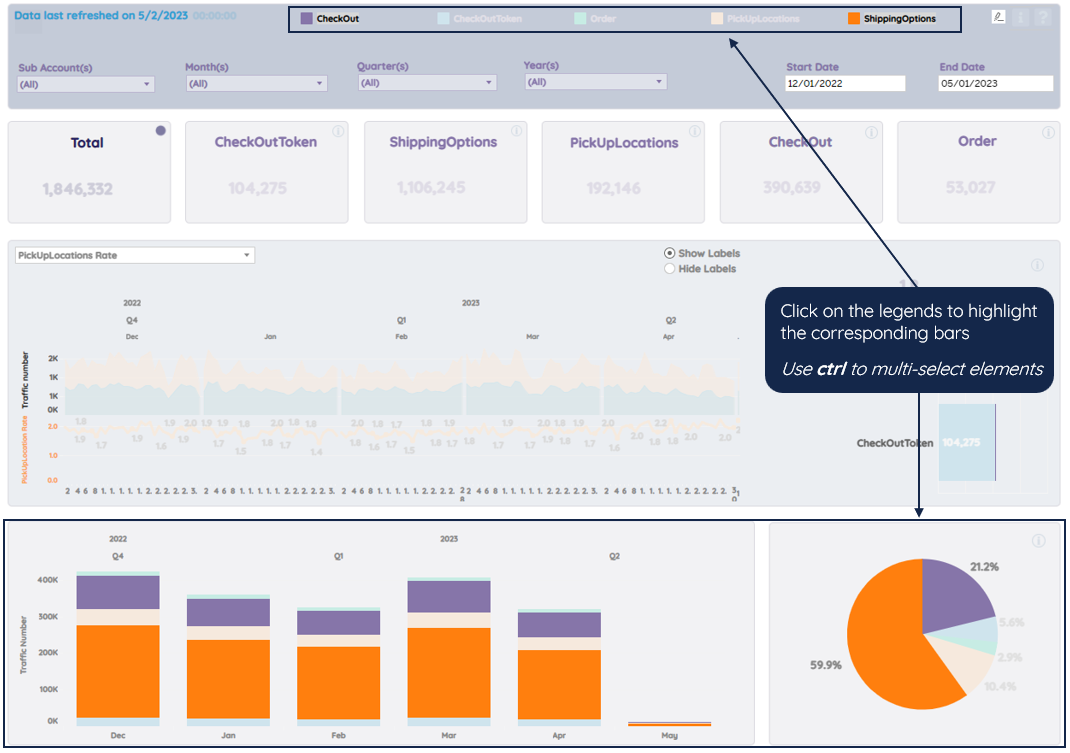
Use the pie chart as a filter for the bar chart on the left.
You can also highlight the endpoints by clicking on the legends.
Note
Unfilter or unhighlight by clicking on the same elements again.
Was this article helpful?
That’s Great!
Thank you for your feedback
Sorry! We couldn't be helpful
Thank you for your feedback
Feedback sent
We appreciate your effort and will try to fix the article